IDE for data science
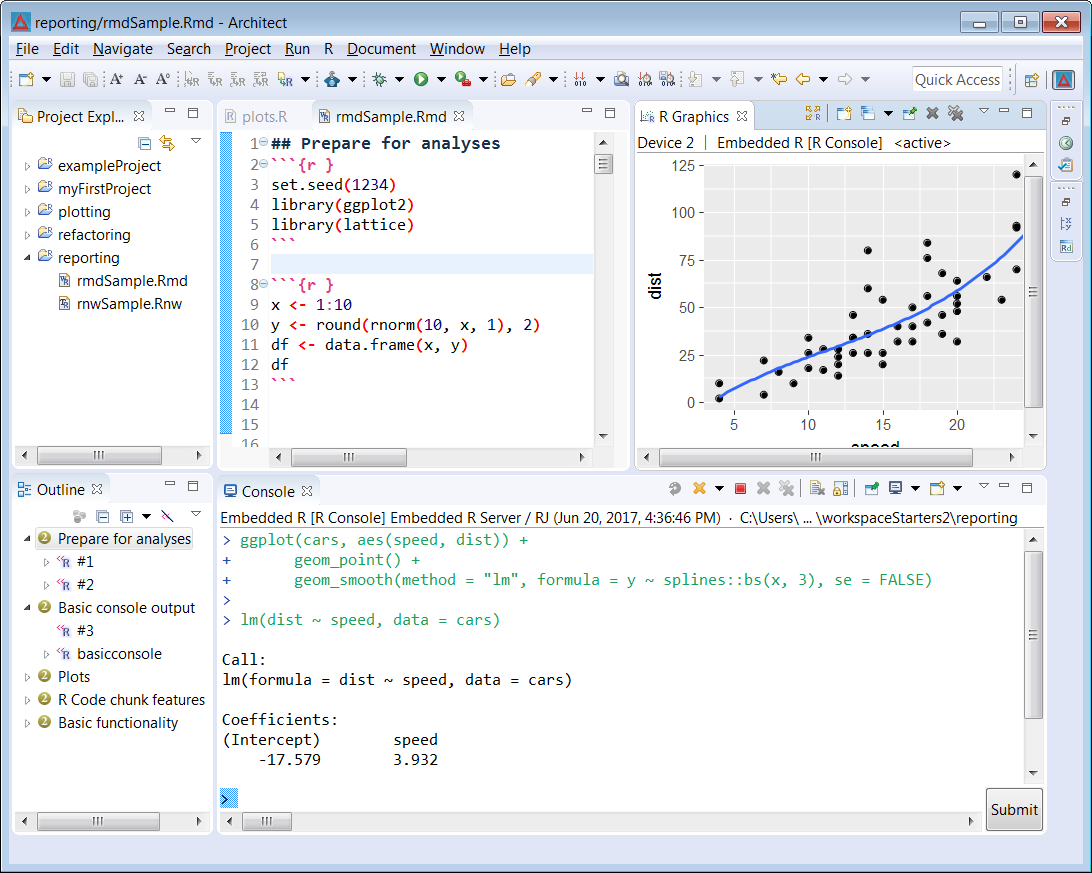
Architect is an integrated development environment (IDE) that focuses specifically on the needs of the data scientist. All data science tasks from analyzing data to writing reports can be performed in a single environment with a common logic. It includes an integrated R console, an integrated object browser and data viewer, and tools for plotting, repository management, package development, workspace management and debugging. Since data science is a complex field where many technologies and languages meet, Architect has been fully embedded in the Eclipse ecosystem. As a consequence Architect can be used to
- work in R, Python, Julia, Scala, C++ etc.
- manage servers in the cloud (AWS and Azure)
- monitor jobs on remote HPC systems
- connect to relational and NoSQL data bases
- manage Docker infrastructure and
- supports many more common tasks a data scientist encounters.
Architect is fully open source, and available on Linux, Mac and Windows.
Run data science apps at scale
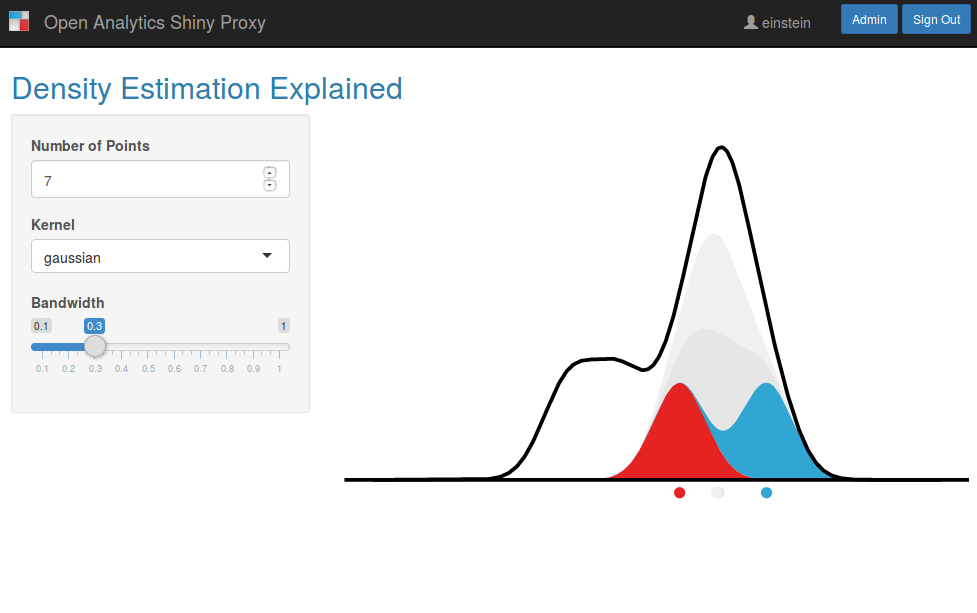
ShinyProxy is 100% open source middleware to deploy data science applications (Shiny, Streamlit, Dash...) at scale in companies and larger organizations. It has built-in functionality for all standard authentication/authorization technologies, supports high availability and can scale to internet scale (i.e. no limits on concurrent usage of your data science apps).
- scale to 1000s of concurrent users on your Shiny applications
- authentication and authorization (LDAP, ActiveDirectory, OIDC, SAML, ...)
- support for single-sign on and identity brokering
- allocate resources (CPU, memory limits) per data science application
- usage statistics and administrator views for monitoring
- ready for integration of data science apps in larger applications
ShinyProxy is fully open source, and available on Linux, Mac and Windows.
Automate statistical analyses
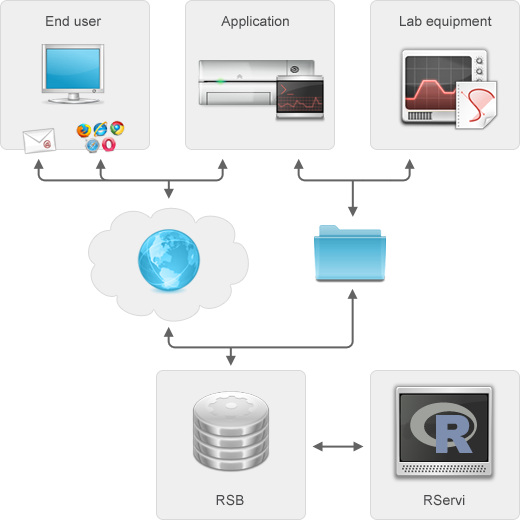
The R Service Bus allows to automate statistical analyses based on R and to integrate such analyses into workflows and business processes. The architecture of the R Service Bus cleanly separates the integration logic (job acceptors and result handlers built on top of a messaging core) from the business logic (end users or software that trigger jobs) and the statistical logic (R scripts and / or functions that perform the actual computation).
- trigger statistical jobs using REST and many other protocols (SOAP, e-mail, (s)ftp, etc.)
- manage jobs for multiple applications using dedicated input and output queues
- scale to thousands of concurrent requests, native load balancing support
- distribute different types of jobs to different R pools
- keep track of usage statistics
- health checks and administration APIs
R Service Bus is fully open source, and available on Linux, Mac and Windows.
Manage R and Python repositories
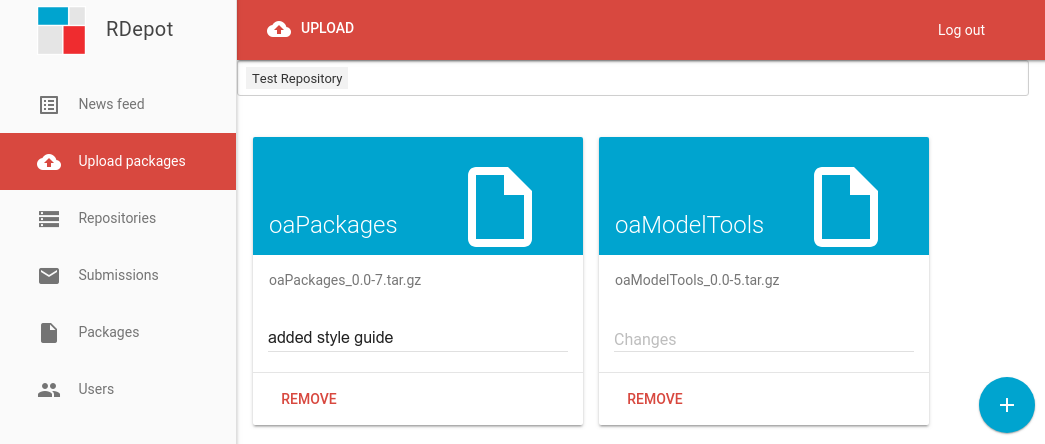
RDepot is a solution for the management of R and Python package repositories in an enterprise environment. It allows to submit packages through a user interface or API and to automatically update and publish R or Python repositories. Multiple departments can manage their own repositories and different users can have different roles in the management of their packages.
- package submission through a user interface and via the REST API
- modern interface to browse packages and repositories
- authentication and fine-grained authorization with repository roles (administrator, repository manager, package manager, user)
- full versioning of repositories and audit trails for use in regulated contexts
- built-in support for load-balanced package repositories
- integration with continuous integration infrastructure for quality assurance on R and Python packages
Analyze high-content screening data
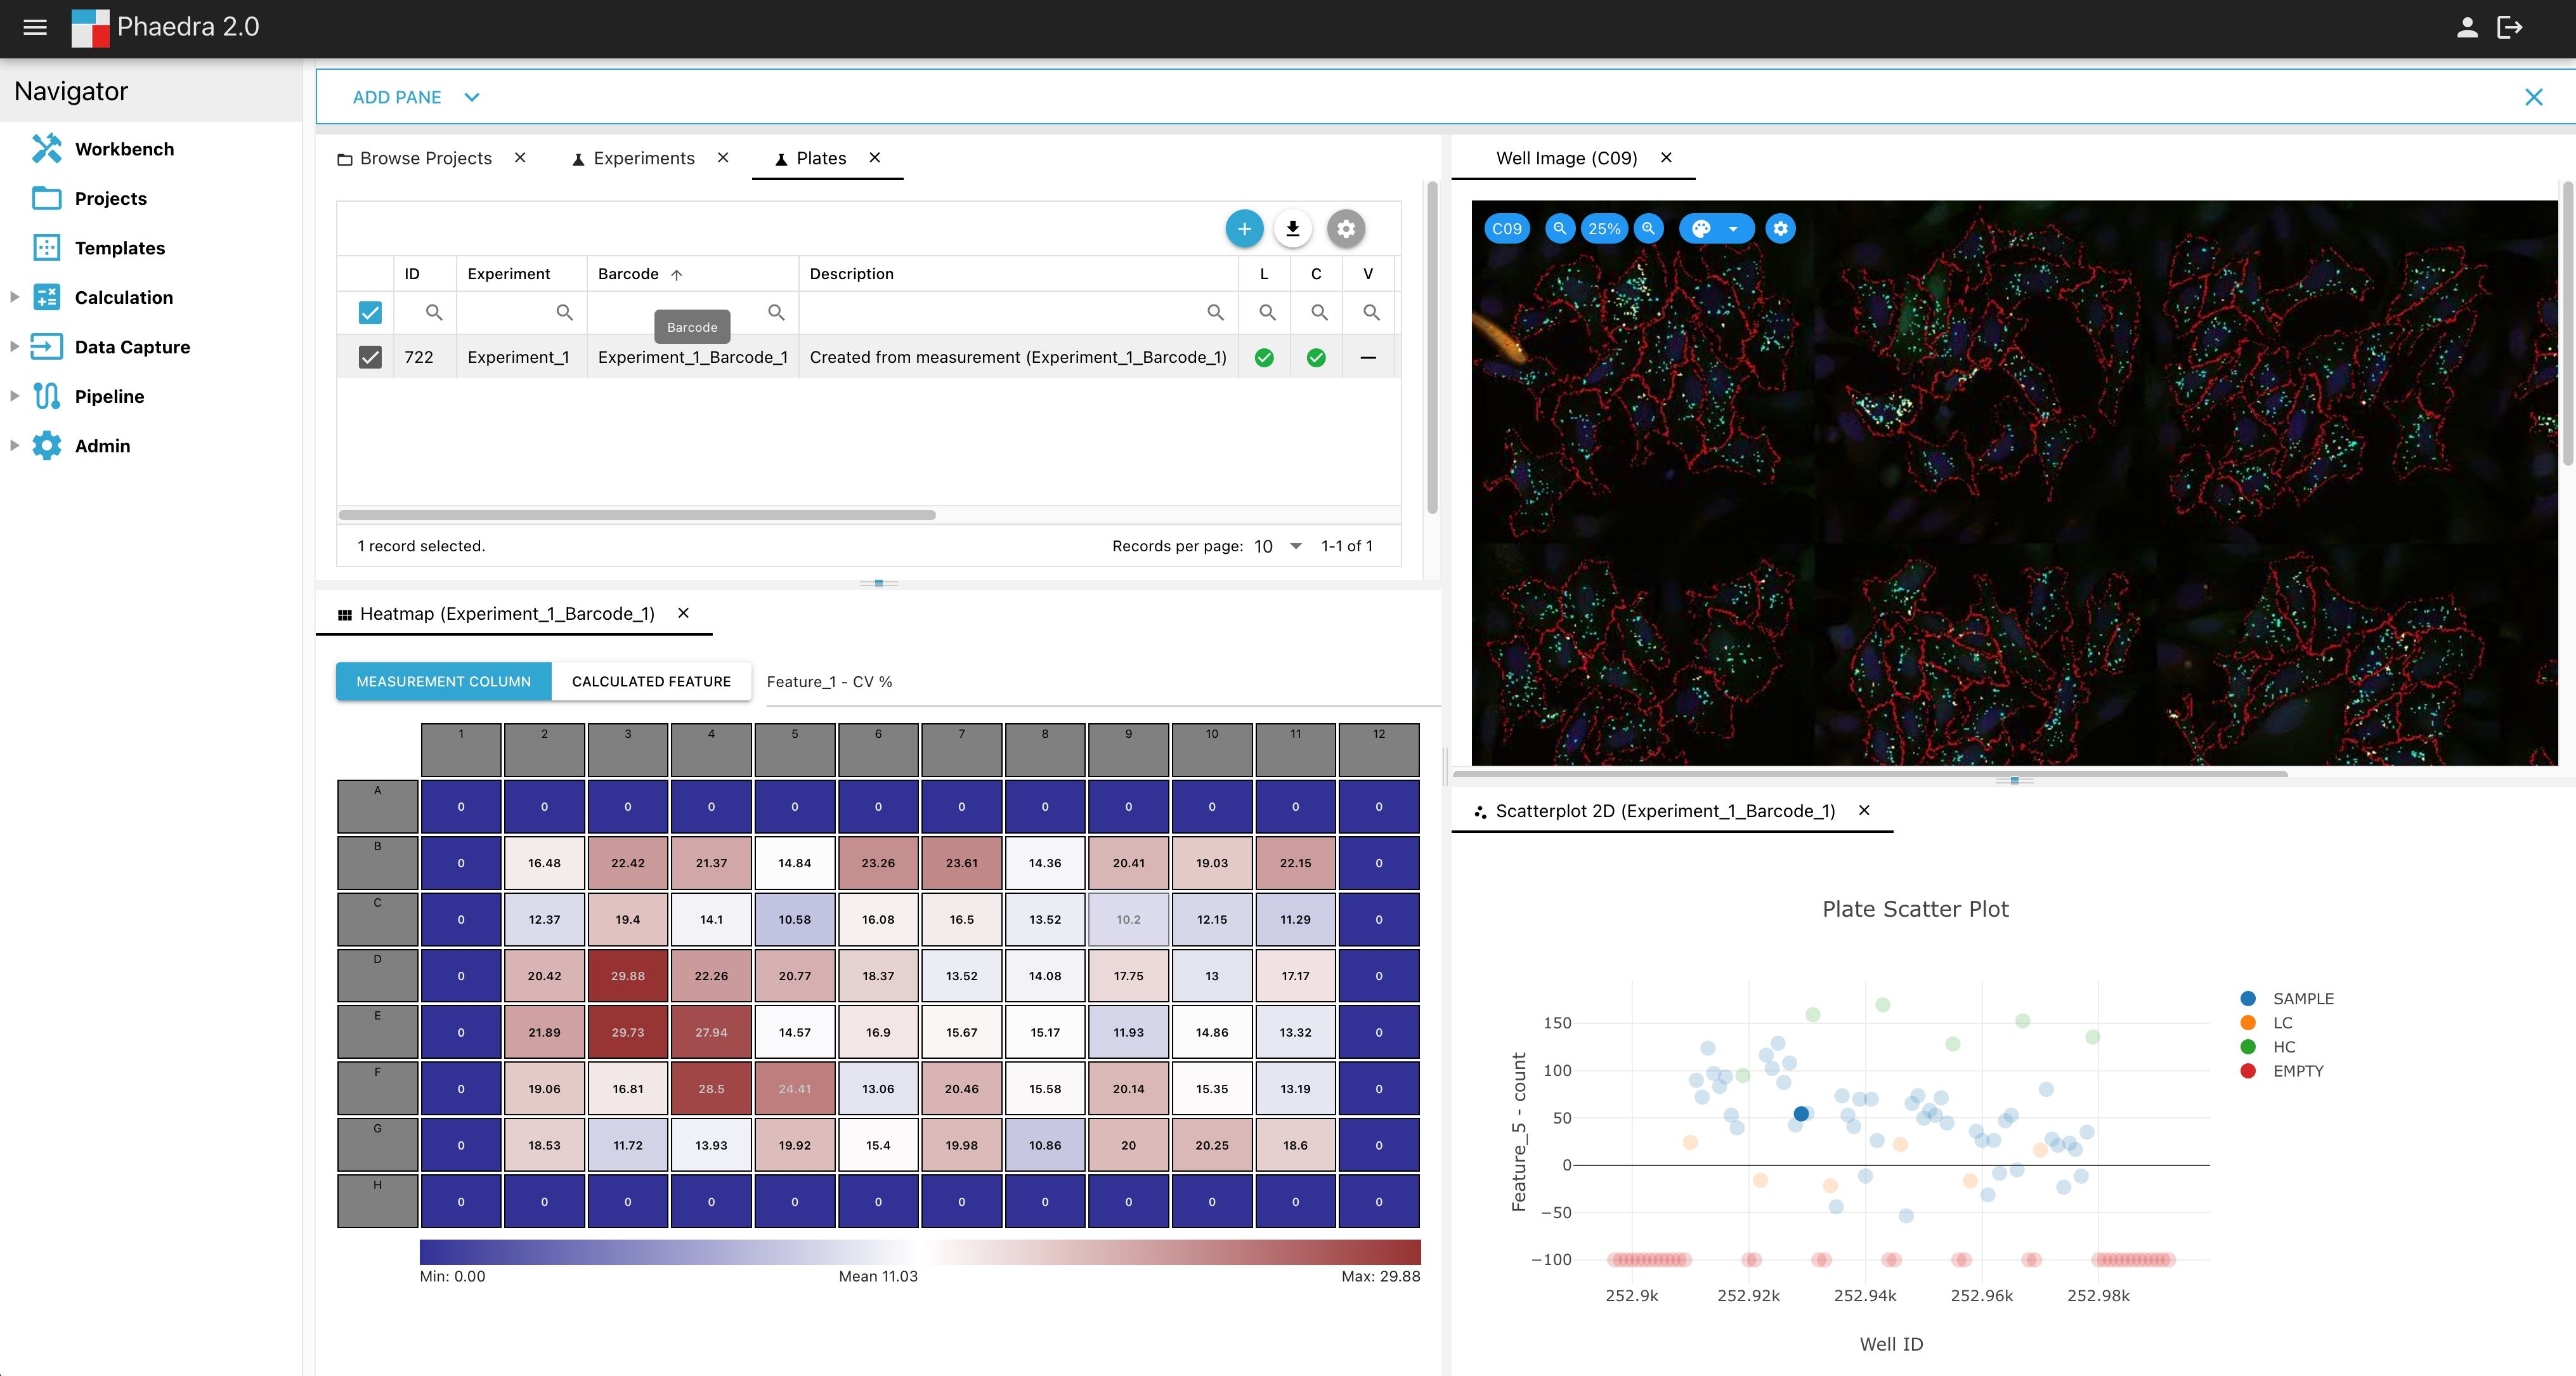
Phaedra is an open source platform for data capture and analysis of high-content screening data. It offers real-time, interactive exploration of imaging data in relation to the quantitative features extracted by image analysis and has been designed for scientists to stay on top of experiments involving 1000s of plates. Client and server functionality are available for scientists to
- import image data from any source
- assess the data with industry's richest toolbox
- improve data quality using intelligent validation methods
- use built-in statistics and machine learning workflows
- generate QC and analysis reports using templates
- script all of the above steps into standardized experiment protocols

